
Today I would like to talk about my final project, which took place at the Center of Biomedical Technology (CTB) of the Universidad Politecnica de Madrid, during the last year of my Master of Science degree in Computer Engineering.
When my period of abroad-study started and I first met my tutor Ernestina Menasalvas Ruiz I didn’t exactly know what was the real impact of the project I was accepting, but still I was attracted by the idea that the hidden value in data could help people suffering for cancer at the hospital and improve their treatments. Thus, I spent about 7 months into this ambitious project.
This article will highlight the main parts of my thesis, avoiding to spend too much time in details. However, if this is not enough detailed for you, here you have my full thesis and the slides of the presentation.
The MiDaS team in June 2019
[UPDATE JULY 2020] This work has been published as a conference paper for the 33rd IEEE International Symposium on Computer-Based Medical Systems!! - link
Objective
This project takes place under the Lung Cancer pilot of an European Project. It aims at building a framework to process clinical data to enable a data-driven decisional process for clinicians willing to optimize the management of lung cancer patients. This framework will enable the measurement of the following Key Performance Indicators:
- KPI 1) Length of hospital stay for oncology patients
- KPI 2) Identification of patients at risk of developing lung cancer
This objective sounds way too abstract, let’s do some business understanding to translate our business goal into a data mining goal.
Business Understanding
The available data for this project is the anonymized dataset of Electronic Health Records, provided by an hospital of Madrid. A single record of this dataset represents any activity, exam result, analysis, treatment, ER admission or discharge report of a patient and, as a consequence, a group of these records for the same patient, represents an hospital process that the patient was subjected to during its hospital stay. Thus, processes have the property of describing the length of hospital stay, the cause of hospitalization, symptoms and other useful information to answer our objectives.
However, some problems arise while taking a first look into the data:
- It presents unstructured clinical notes written in natural language (Spanish language), which often contains abbreviations and misspelled words, since they are always written by clinicians with a short amount of time available to write down notes.
- There is no trace about processes to which the patients were subjected to
Grouping clinical notes into processes will enable KPIs measurements (length of hospital stay, number of doctors involved per patient, number of unscheduled visits, etc.) and also improve hospital services by identifying evidences before cancer diagnosis that may lead physicians to clinical suspicion of lung cancer. This improvements will help future patients to be diagnosed at earlier stages of cancer and live longer.
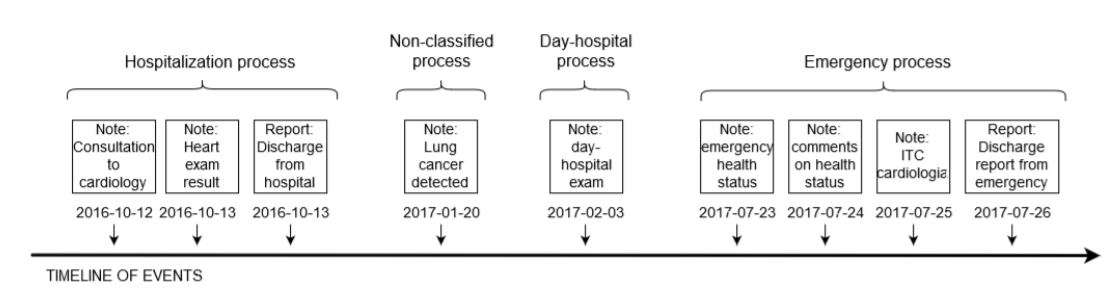
An example of documents grouped into processes
Another useful information, gained by early explorations of data and by talking with the doctors of the hospital, is the phase diagram of a patient being hospitalized.
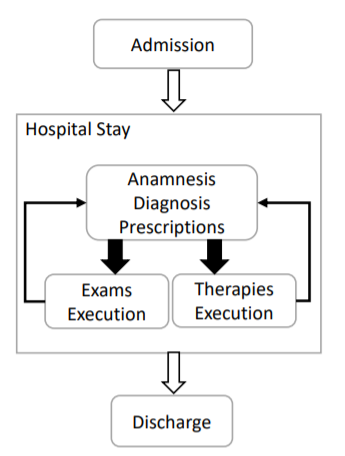
Process diagram of patient’s hospitalization
This diagram tells us that a process is a well-defined set of documents where there must be, in the ideal case, a note talking about the admission and a note talking about the discharge of a patient.
Data Understanding
A quick overview of the dataset is given:
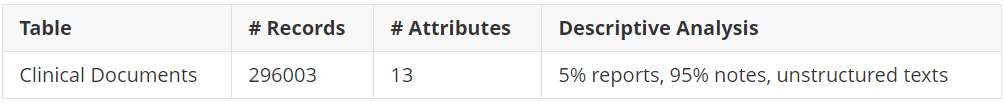
Dataset overview
Clinical documents are divided into two main classes: notes and reports.
A report, gives a detailed description of the symptoms, signs, diagnosis, treatment, and follow-up of an individual patient. The text is divided in paragraphs having the name of the paragraph on top. In figure, a sample of a possible report is presented.
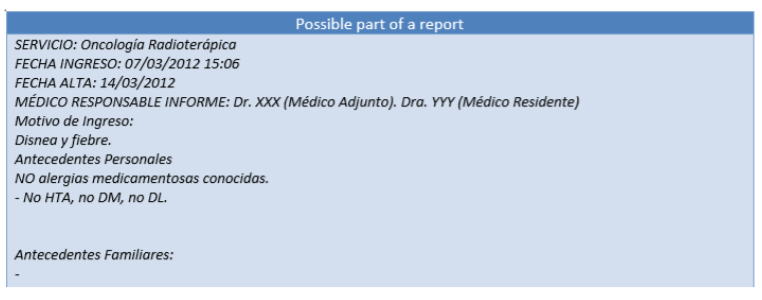
Example report
a note is usually a short text updating other nurses about the status of the patient, its cause of hospitalization, consultations and so on, according to the specified subcategory. Often this type of document does not present any structure/paragraph. In figure, an example note is presented.
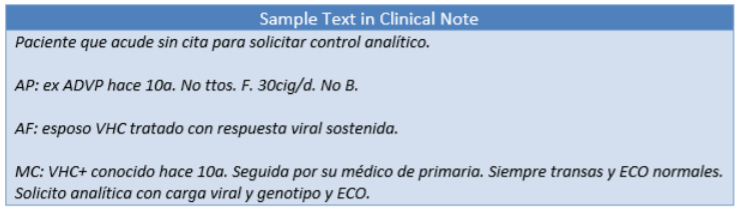
Example note
Since, reports contain the most useful informations to extract processes, let’s see how many reports per patients we have.
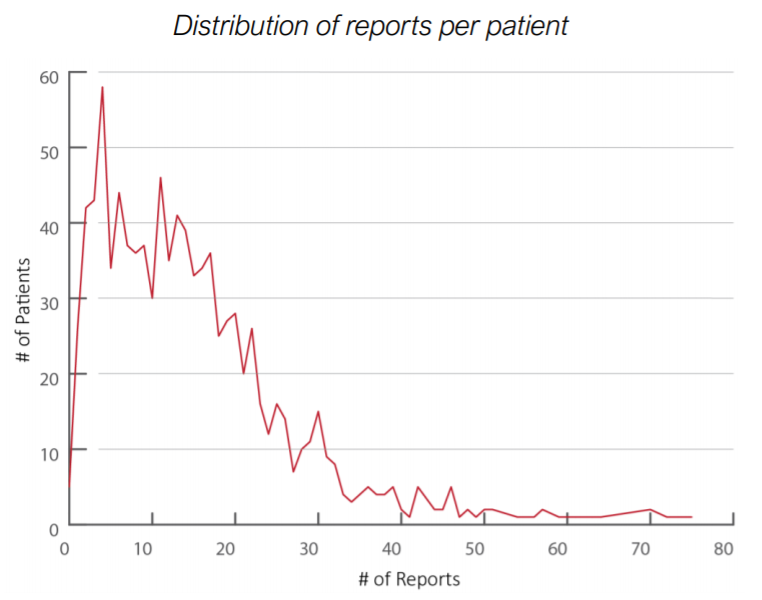
Distribution of reports per patient
The number of reports per patient is on average 13. For those patients having 0 reports records it will be difficult to have processes extracted relying only on hospitalization and discharge dates, due to this lack. By the way, the number of patients having 0 reports is negligible.
Framework Design
With all the knowledge acquired in the business and data understanding phase, there was evidence that being able to extract processes from clinical notes would enable measurements for accomplishing the objectives. Thus, the objective of the project becomes more clear: building a framework to process Electronic Health Records and produces a set of semantically grouped notes for each patient (i.e. Hospital Processes).
The framework will be a data pipeline, having as input the dataset of EHRs and as output the set of Hospital Processes.
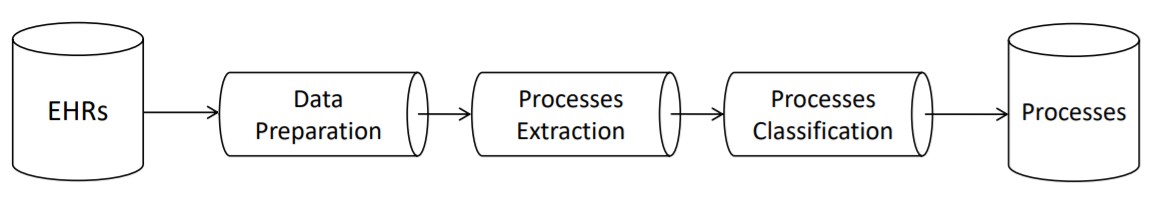
Framework design: processing pipeline
The process will work as follows:
- EHRs are cleaned and enriched with dates information extracted from raw text
- EHRs are inserted into semantically related group of notes
- The group of notes are then classified into a limited set of labels
This framework is written in the R language, that is the most popular language for data analysis tasks. R has been favored over Python due to the presence of powerful libraries, such as ggplot2, dplyr and stringr, which are a perfect match for my needs. Furthermore, due to the need of a rapid prototyping language a scripting language is preferred over a compiled language such as Java or C++ (performance is not needed at this point of the project).
Let’s dive into the details of the pipeline.
Data Preparation
As a first step, data cleaning techniques are applied to raw texts of clinical notes. The operations performed by this step consists of:
- Conversion of all words into lowercase
- Special characters removal (punctuation, accented letters) excepting slashes (/) since dates appear in the form dd/MM/yyyy
- Stop-words removal (using the Spanish dictionary)
- Fixing words spacing (leaving only one white space between words)
At this point, texts have the following aspect:
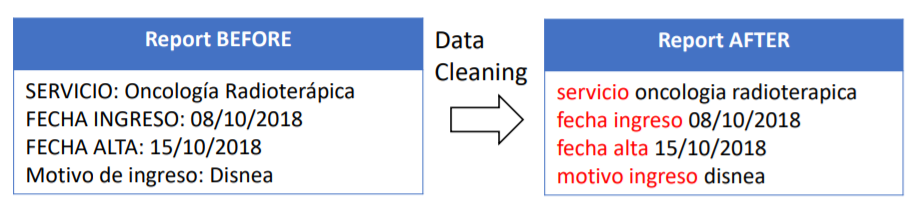
An example report’s contents before and after data cleaning
Once all texts obtain a standard form that simplifies pattern matching operations, it is time to search for useful information inside texts. The objective is now to extract: admission dates, discharge dates, hospital services visited and causes of hospitalization (symptoms).
For dates, it is rather a simple task, in fact, to search for admission dates and discharge dates, the keywords “fecha ingreso” (Spanish translation for admission date) and “fecha alta” (Spanish translation for discharge date) are used. This approach extracted 20548 dates.
But, how do we search for hospital services and symptoms information inside texts? What we want to extract here is a set of words describing the health conditions of a patient, and the hospital service visited. Thus the problem becomes recognizing names of diseases and/or services in a bag of words. This is the case in which UMLS — Unified Medical Language System is used.
A UMLS integrates and distributes key terminology, classification and coding standards, and associated resources to promote creation of more effective and interoperable biomedical information systems and services, including Electronic Health Records. This tool will work as a dictionary lookup method, to map a word read from text to a medical concept. To do this, the whole set of texts are parsed and classified each, resulting in a dictionary of more than 10 million concepts.
As a result of this approach, the extraction found 8780 causes of hospitalization and 11944 services visited.
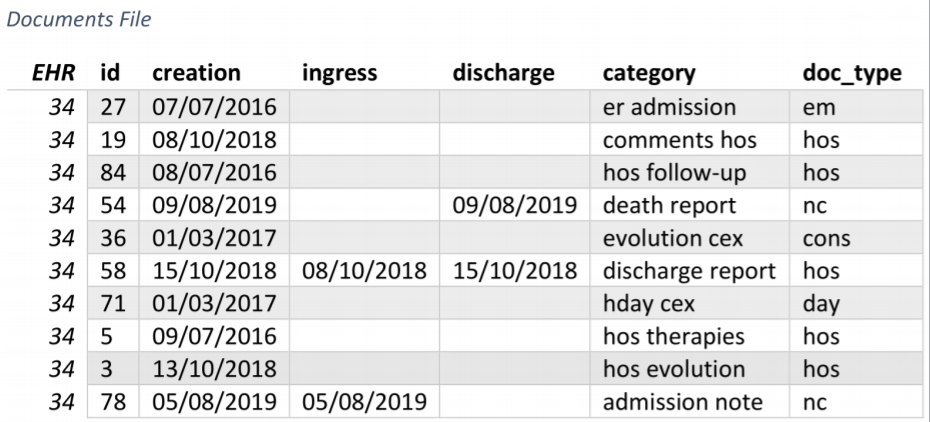
The enhanced dataset now have the following structure:
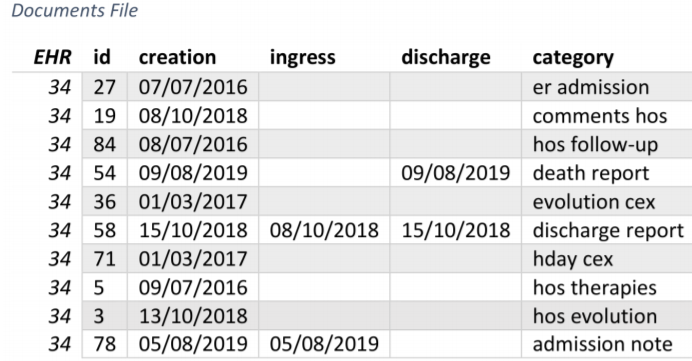
New fields in the dataset after data preparation
Note: EHR field is the identification code of the patient. Category field was already provided by the original dataset_
Processes Extraction
Until now, we have been enriching our available information on documents in order to make it easier to extract processes. Extracting processes from documents in fact, represents a key-objective of this project, and their quality will be crucial for the reliability of further analysis using them. The evaluation metric used to assess the algorithm is the coverage. Coverage is the number of documents which belongs to at least 1 process.
The desired output of this step is a table having the following schema:
- EHR — unique identifier of the patient, actor of the process
- Ingress — start date of the process
- Discharge — end date of the process
- PID — process ID i.e. unique identifier of the process
Hospitalization and discharge dates form a date range that can be used to identify processes. The main idea is that a process is a date range, and so, all documents whose creation date is in between any date range will be considered as part of that process. Thus, the number of processes extracted is directly dependent on the number of date ranges available in the documents file.
By only using existing date ranges extracted from texts the coverage obtained is only 65.4%. This is not sufficient, and for sure there is margin of improvement. Some observations must be done:
- Existing date ranges come with noise, due to human errors or incomplete reports, leaving notes or reports outside their corresponding process, and thus worsening the coverage
- There are some notes created in consecutive days which are not mentioned in any existing date range. However, they could still be part of a process, and thus grouped together.
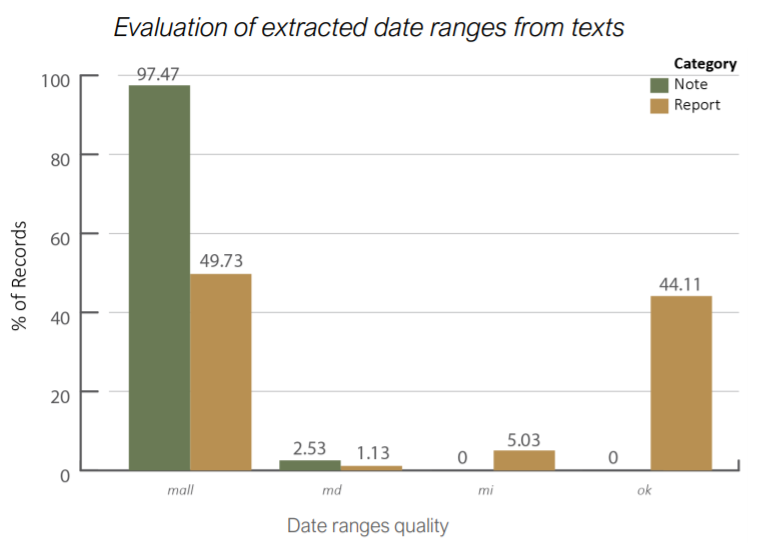
This plot shows the quality of date ranges extracted: MALL are empty date ranges, MD are ranges with missing discharge date, MI are ranges with missing ingress date and OK are full filled date ranges._
These two observations leads into a major improvement.
Improving Processes Extraction
After observing which is the margin for improvements, the processes extraction algorithm needs two assumptions for being modified:
- Consecutive-days processes — group of notes created in consecutive days will belong to the same process
- Single-day processes — group of notes created in the same day will belong to the same process
The algorithm works as follows:
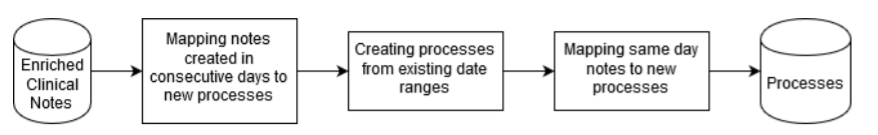
Processes Extraction Algorithm
For each patient:
- Search groups of documents created in consecutive days
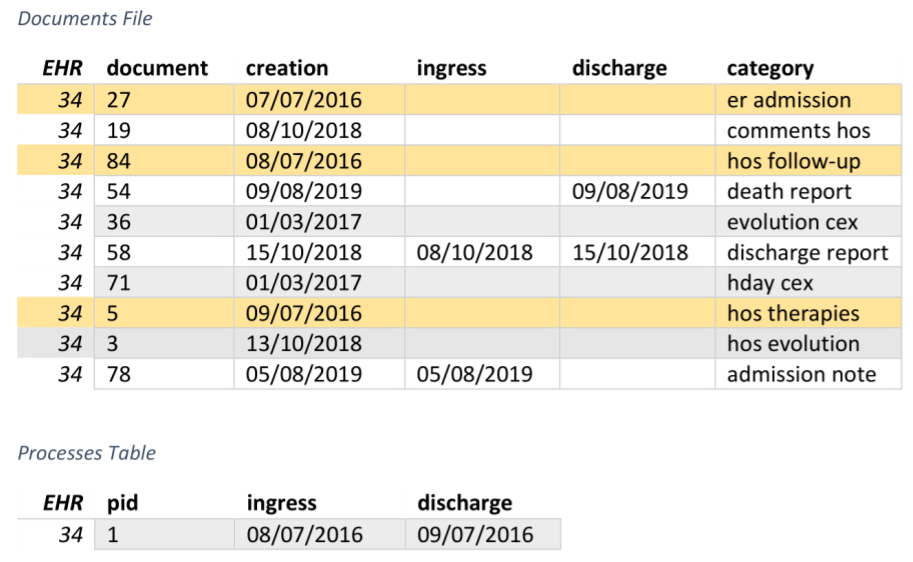
Processes extraction algorithm: first step
2. Use existing date ranges from texts
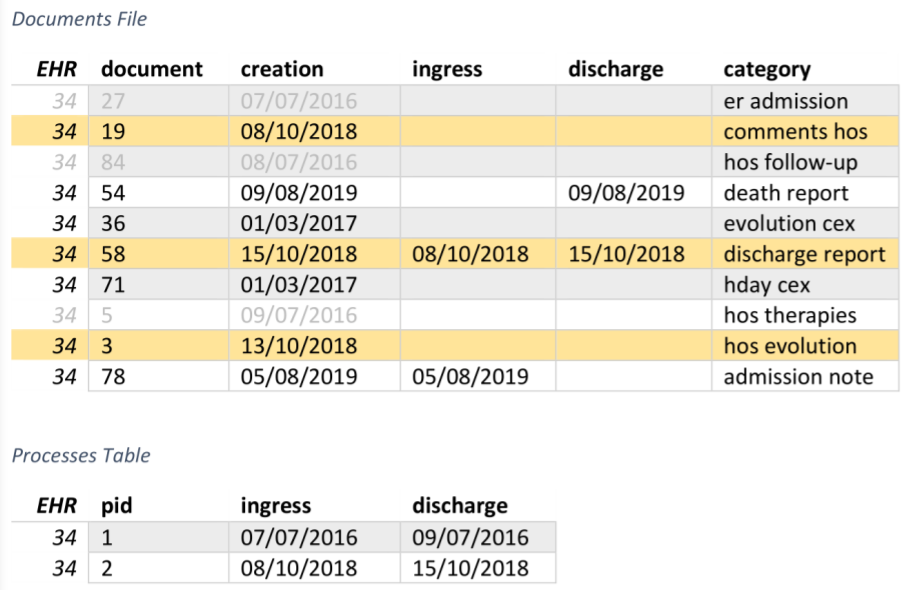
Processes extraction algorithm: second step
3. Search groups of documents created in the same day
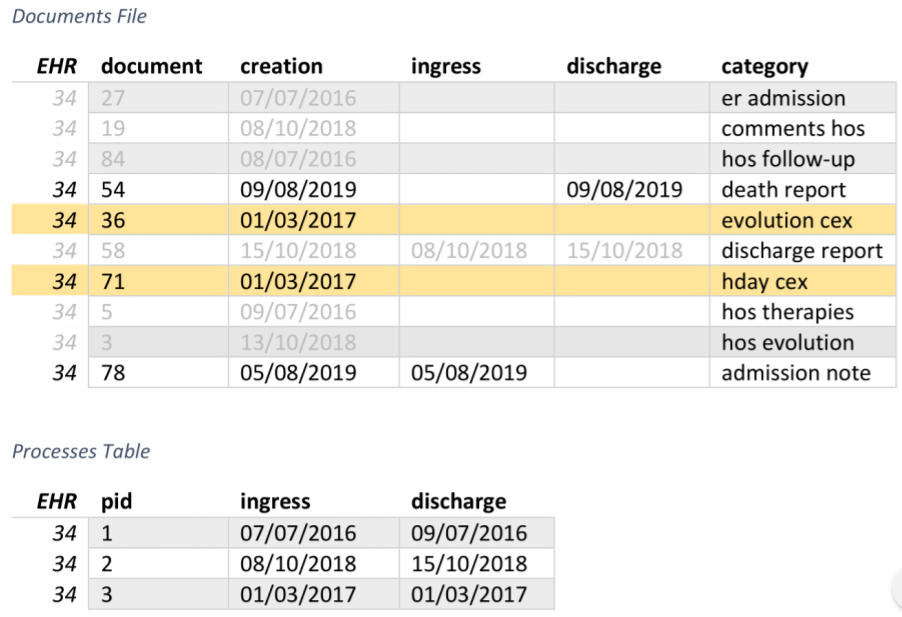
Processes extraction algorithm: third step
The results are surprisingly better than expected! 91.8% of coverage.
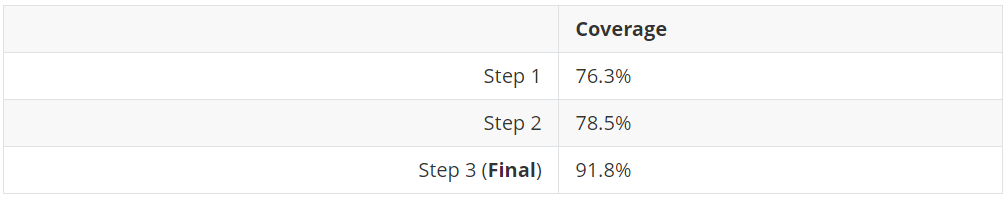
Coverage results produced by the algorithm
Processes Classification
Before this step takes place, the original Category field of documents is restricted into a limited set, passing from 128 categories to just 5 macro-categories.
Categories have been mapped to the doc_type field that is a set of macro-categories
Then processes are classified into a set of categories defined by clinicians. These categories are:
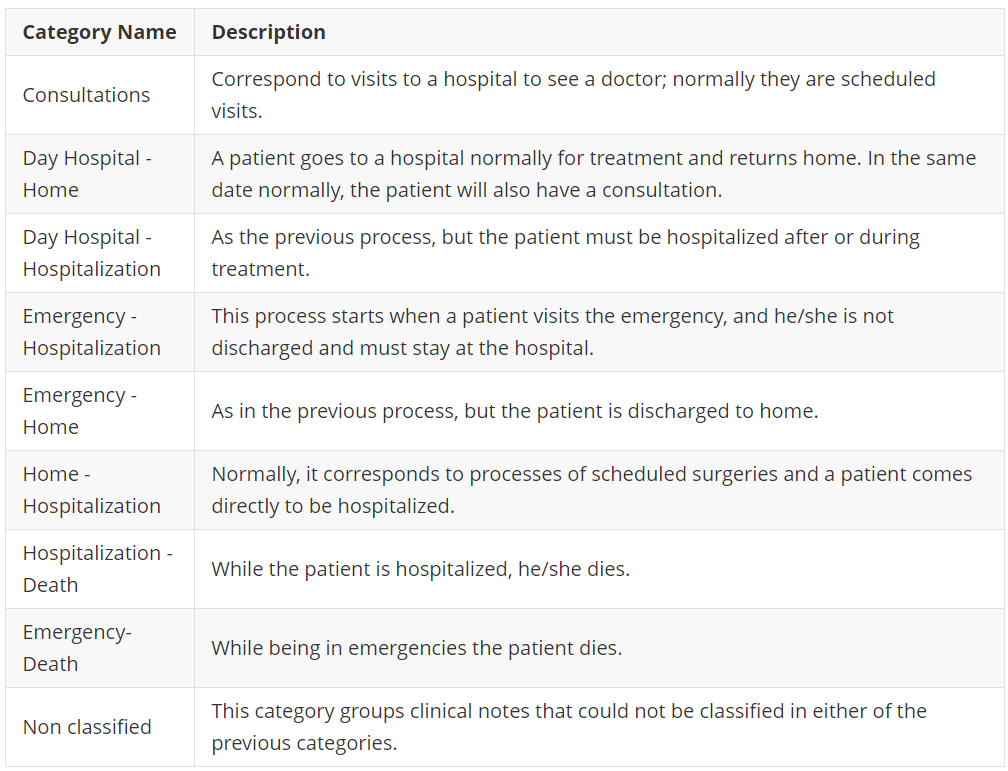
List of categories
Thus each process is assigned to the most representing class. No supervised learning approach could be used at this task due to lack of labelled data. Again, this task has been performed by extracting features from documents inside each process and then applying a set of manually defined if-else rules. To do that we can combine the following characteristics inside processes:
- Majority of documents’ category inside PID — Each document has its own category. Thus PID category could be inferred by looking to which category belongs the majority of documents inside a PID.
- Looking for the category of discharge reports — Discharge reports come with a fixed nomenclature inside its title. e.g. “informe alta hospitalizacion” (discharge report), “informe alta urgencias” (discharge from emergency report), “informe alta consulta” (discharge from consultation report). Thus, they could describe the whole process if found inside a PID.
By combining these information, the category could be assigned by looking at the majority of documents category and presence of particular “alta” (discharge) note, with weighted biases.
About 99.1% of processes were classified.
Results
A final set of 48849 processes were extracted, with an average of 81 processes per patient. Of these, 4898 processes describe also the service visited and cause of hospitalization.
The first result is the measure of the Length of hospital stay KPI:
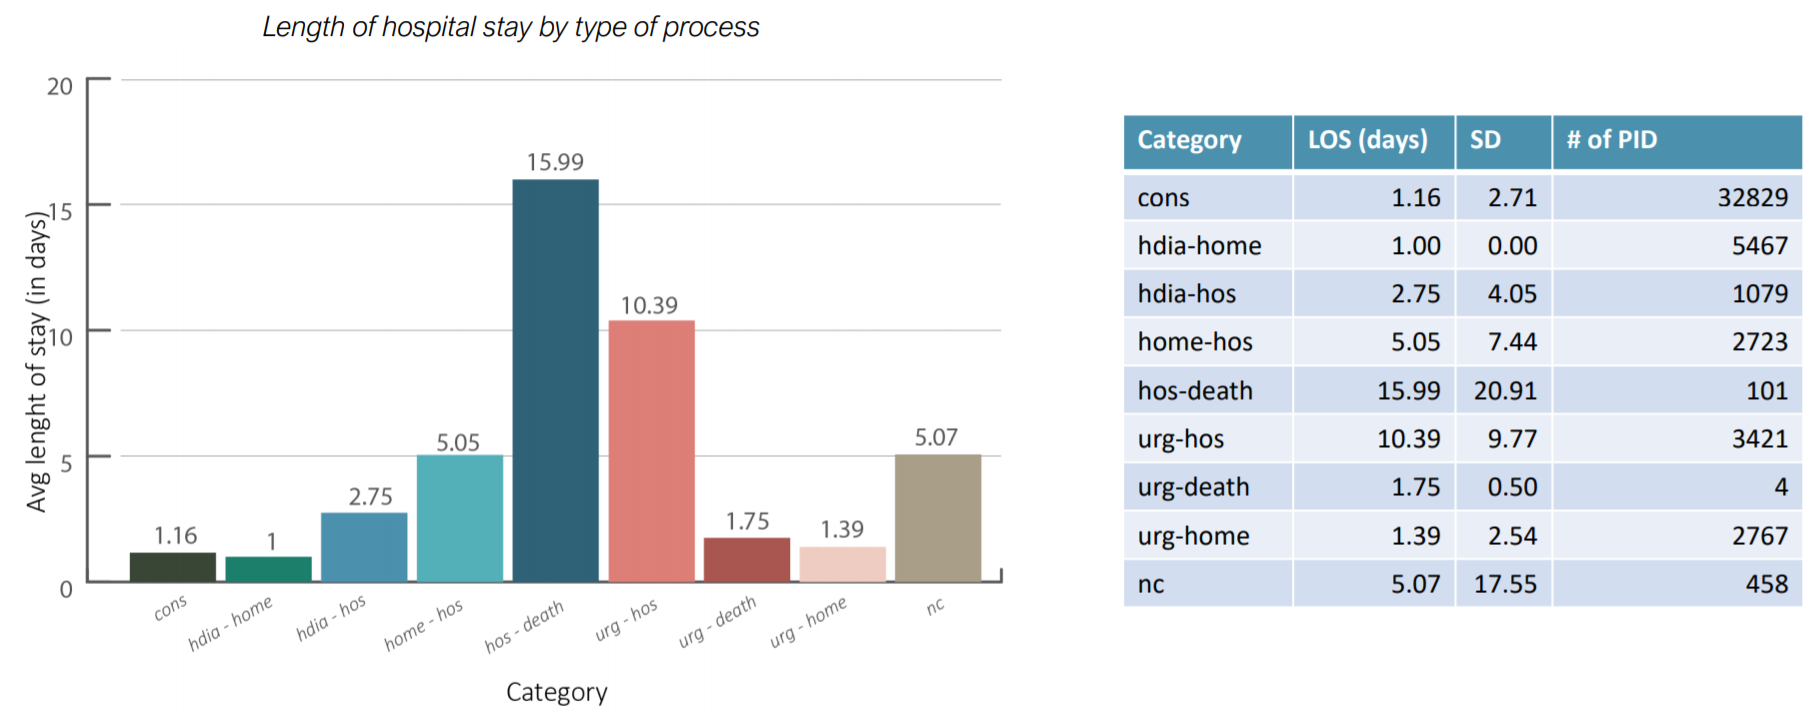
Results of the Length of hospital stay KPI
It is interesting to notice that patients near to death, here grouped as hos-death, are the ones to stay longer at the hospital. It could be interesting to see if there is any specific profile for patients which are subjected to hos-death processes. Furthermore, this result shows where clinicians can optimize the length of stay based on the type of process, thus differentiating policies by type of process.
The second result shows two measures of interest for the Identification of patients at risk KPI:
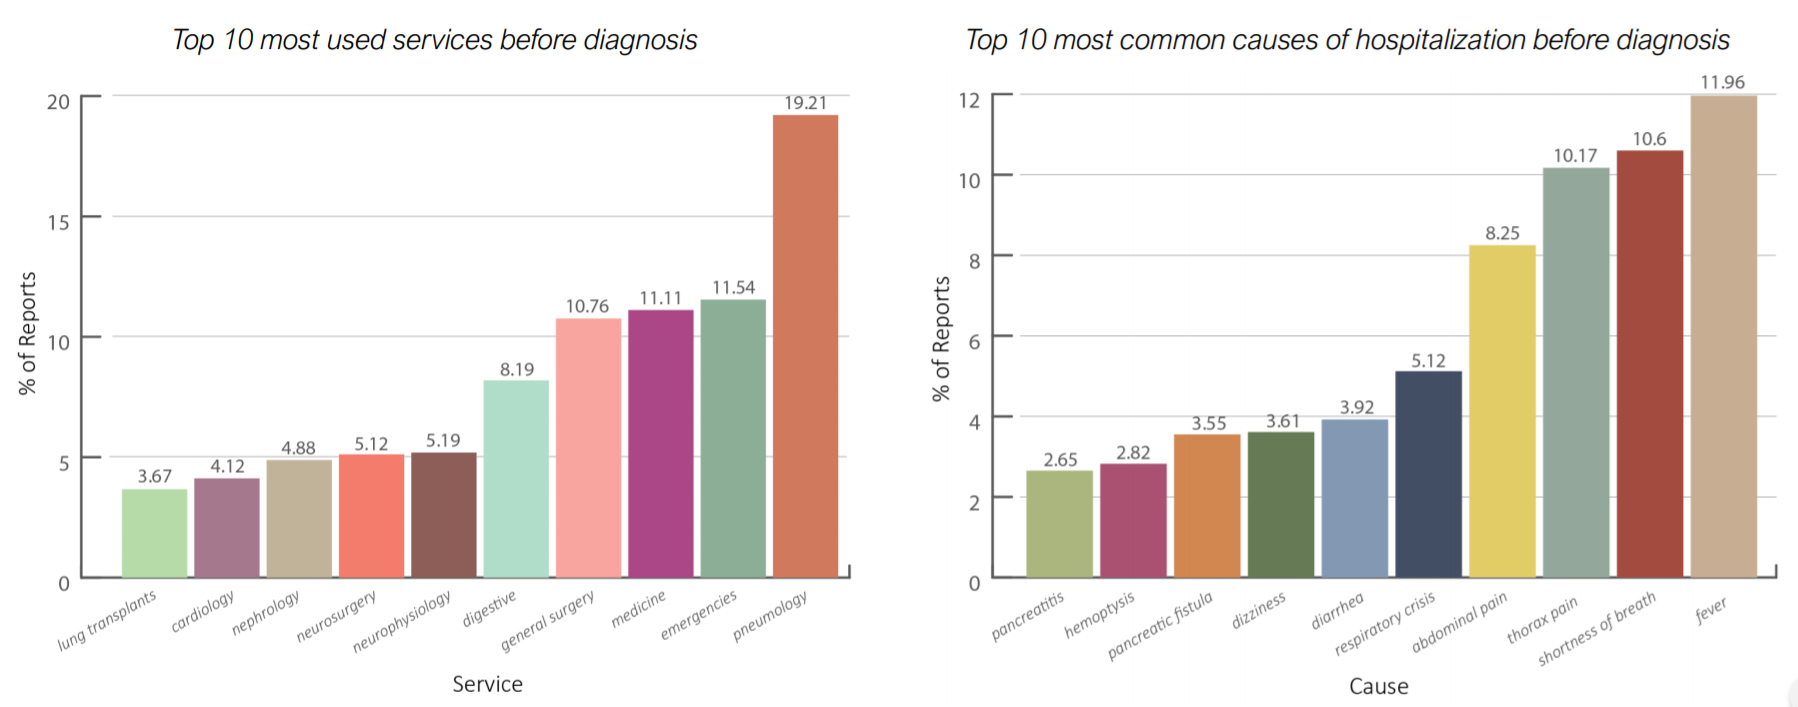
Results of the Identification of patients at risk KPI
The most common symptoms are fever (fiebre), shortness of breath (disnea), abdominal pain and thorax pain. These are diseases that often relates with lung cancer patients. Furthermore, the most used service is Pneumology (neumologia) followed by Emergencies (urgencias generales) and medicine (medicina interna). Also Cardiology (cardiologia) has a relevant position in this chart. Pneumology, Emergencies and Cardiology are services more likely to be visited by patients suffering with lung cancer, at the time of visit reported in the graph they didn’t know that they were developing lung cancer. This leaves us with some open questions: how can we diagnose cancer faster? does the doctor pay sufficient attention to the symptoms of his patients?
The final validation of processes extraction and classification is delegated to clinicians which reviewed the measures of KPIs. Other results are available in the full thesis.
Conclusions and Future Work
This work put evidences in ways of improving lung cancer diagnosis and measures of hospital performances. It also shows how the analysis of big data can be a real game changer in a business process of a company (in this case of a hospital).
Further work on the framework is needed:
- Improve quality of processes by understanding contents of texts (NLU approaches)
- Integrate multiple sources of data to measure other KPIs
- Integrate data from other hospitals to discover common patterns
- Build a SaaS (Software as a Service) from this framework, accessible via public APIs